
Introduction
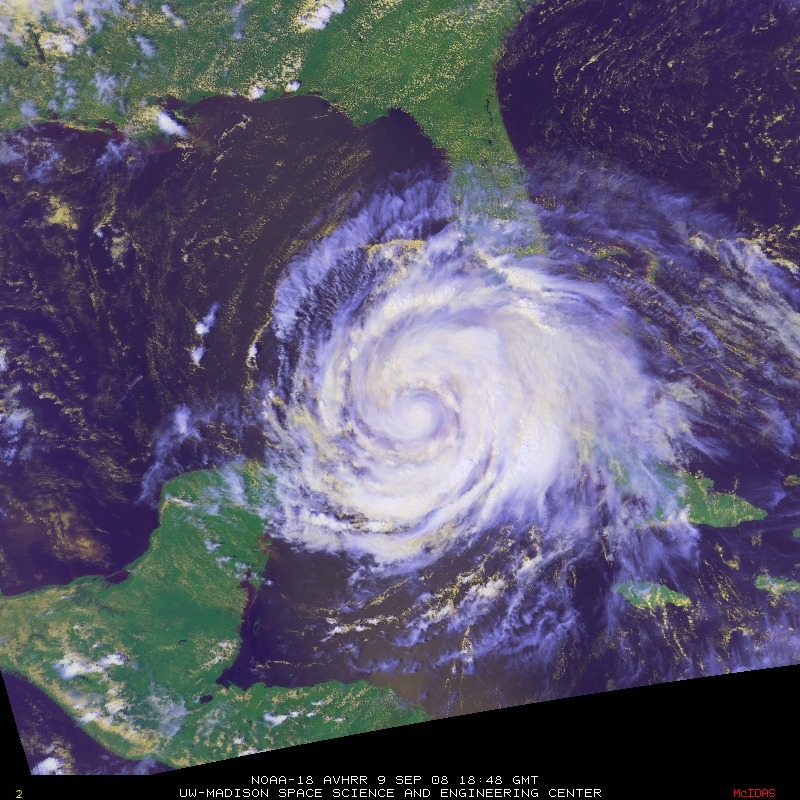
Hurricane Ike was one of the costliest hurricanes ever to make landfall in the United States. By some estimates it caused over $27 billion dollars in damage and 112 deaths in Texas, Louisiana and Mississippi. Ike made landfall near Galveston, TX as a Category 2 storm on September 13, 2008 (though earlier in its life it was as strong as a category 4 storm). Even the remnants of Ike were strong; one of the reasons I picked it was because of the extensive flooding caused in the Midwest, where I live.
Track of Hurricane Ike, September 2008. The storm made landfall as a Category 2 storm in Texas, though earlier in its life it was Category 4. Its strength varied widely as shown on the track. After losing its tropical character, Ike continued to track up through the Mississippi valley into the Midwest, bringing heavy rainfall throughout the region. http://tropic.ssec.wisc.edu/storm_archive/2008/storms/ike/IKE.track.gif, http://tropic.ssec.wisc.edu/storm_archive/2008/storms/ike/ike.html
This article will examine Ike’s intensity shortly before landfall on the Texas coast, focusing on observations made around 1200Z on September 12, 2008.
Analysis: Three Data Sources
We will be examining three separate types of data, all taken from observations on September 12, 2008, at the same time around 1200Z. We will examine a Vortex data message (VDM) from a “Hurricane Hunter” flight, a multiplatform satellite surface wind analysis, and a HRD Wind Analysis, with the purpose of better understanding how these types of data allow us to determine tropical cyclone (TC) intensity.
Vortex Data Message
VDMs are transmitted by Hurricane Hunter flights from the USAFR’s 53rd Weather Reconnaisance Squadron. The 53rd’s WC-130Js are tasked with flying through hurricanes such as Ike and transmitting data to the National Hurricane Center (NHC). These messages provide data on the current strength and character of the storm. In addition to data gathered from various sensors on the WC-130J, the VDM contains impressions from the flight meteorologist on board the plane, an important eyewitness and reality check to the sensor data.
On September 12, 2008, at 1142Z, a Hurricane Hunter transmitted the following VDM:
;)
Below is an annotated VDM, interpreting each line (PDF).
Interpreted VDM. The header blocks (no letters) indicate the mission ID, storm ID – e.g. AL092008 is the 9th TC in the Atlantic in 2008. Click on PDF link above for an easier-to-read version.
Besides the obvious data points such as maximum recorded flight level winds, estimated minimum sea-level pressure and estimated surface winds, the VDM provides a number of other data points which help us analyze storm intensity. For example, item I provides the temperature outside the eye, and item J provides the temperature inside the eye.
Table of Select VDMs – Items I & J
| Date | Time | Outside Temp (I) | Inside Temp (J) | Temp Difference | Pressure (H) |
| 5-Sep | 1710Z | 10 | 15 | 5 | 959 mb |
| 6-Sep | 0655Z | 10 | 14 | 4 | 963 mb |
| 7-Sep | 0754Z | 13 | 15 | 2 | 948 mb |
| 8-Sep | 1803Z | 10 | 12 | 2 | 970 mb |
| 9-Sep | 0618Z | 11 | 14 | 3 | NA mb |
| 10-Sep | 0553Z | 11 | 14 | 3 | 964 mb |
| 11-Sep | 0541Z | 13 | 18 | 5 | 947 mb |
| 12-Sep | 0409Z | 12 | 17 | 5 | 956 mb |
| 12-Sep | 1142Z | 13 | 15 | 2 | 954 mb |
| 12-Sep | 2325Z | 10 | 17 | 7 | 954 mb |
| 13-Sep | 0235Z | 10 | 16 | 6 | 953 mb |
| 13-Sep | 0631Z | 11 | 16 | 5 | 953 mb |
All temps in C. Data source
An eye warmer than the atmosphere surrounding it is characteristic of a strong TC, with a greater differential indicating a stronger storm. The fluctuations in the temperature differential shown above are also generally consistent with the fluctuations in the strength of Ike as it passed westward across the islands, Cuba and the Gulf towards landfall. The correlation of higher temperature to lower surface pressure, while not perfect, is there.
In summary, the VDM indicates a maximum intensity (surface wind speed) of 65 kts from Line D of the VDM. However, see the conclusion below for an important caveat.
Multiplatform Satellite Surface Wind Analysis
The multiplatform satellite surface wind analysis (“multiplatform analysis”), as its name suggests, relies upon the input of several remote sensors (satellites), which are then combined into a single analysis. Below is the analysis for 1200Z on September 12, 2008, shortly after the VDM above.
;)
The image above is built from several building blocks, including data derived from AMSU-A, data from cloud-drift winds based on IR and water vapor imagery, surface winds derived from cloud temperatures on IR imagery, and scatterometry data from the Quickscat satellite.
In particular, scatterometry data from the QuikSCAT satellite was used and its contribution can be seen here:
;)
The approximate maximum wind shown with icons is in the range of 80-95 kts to the northeast of the center of the storm. The black isotachs are spaced at 15 kt increments. VMax is shown on the data block as 91 kts.
HRD Wind Analysis
The third source of data we will examine is a wind analysis from the Hurricane Research Division (HRD) of NOAA. Here is the 1330Z image from September 12, 2008, approximately 90 minutes after the time of the vortex data message and multiplatform analysis discussed above.
HRD Wind analysis from 1300Z on September 12, 2008. This is the 4 degree view, which shows a reasonable amount of detail and still provides enough coverage to understand the structure of the storm and the context. Shown above is the image with a 4 degree coverage on the map. Larger scale 2 degree and smaller scale 8 degree coverage is also available at the source. Source: http://www.aoml.noaa.gov/hrd/Storm_pages/ike2008/wind.html
The HRD wind analyses combine data from several sources, including ships, buoys, SFMR measurements and dropsonodes from NOAA research aircraft and USAFR C-130s, QuikScat and TRMM satellites, and GOES cloud drift winds. These analyses help bridge the gap between subjective and objective estimates of wind speed by applying objective analysis to as much data as possible.
Data sources which were inputs into the HRD analysis. The SFMR data in particular provided wide coverage over the 4 degree area of coverage; the alpha patterns of the flights are clearly identifiable. Data: HRD. ftp://ftp.aoml.noaa.gov/hrd/pub/hwind/2008/AL092008/0912/1330/AL092008_0912_1330_dataCoverage04.png
Looking at the data source image provided by HRD, above, as well as the caption of the analysis itself, we can see that the HRD wind analysis we are looking at relied heavily on SFMR imagery from recon flights (in yellow), GPS dropsonodes (in pink/maroon and green) as well as a fortuitous moored buoy NW of the center. These may be easier to see in the 2 degree image here.
In summary, the HRD wind analysis suggests maximum surface winds of 93 kts.
Conclusion
The three tools we looked at suggested different maximum surface wind speeds: the vortex message suggested 65kts, the multiplatform analysis suggests 91 kts, and the HRD wind analysis suggests max wind of 93 kts. The outlier clearly is the VDM; the other two analyses are consistent with each other. The VDM and HRD analysis have the advantage of combining in-situ and remote sensing to corroborate data. Why is the VDM so far “off” of the other two data sources?
To explain this anomaly, we can look to the other VDMs from approximately the same time and mission. VDMs from the same flight (AF301) show estimated max wind speeds (item D, the inflight meteorologists’ estimate of surface wind speed) of 88kts at 1326Z, 81 kts at 1505Z, and 63 kts at 1721Z. The subsequent flight (AF304) showed speeds varying 76-89kts from 2038Z to 0235Z the next day. The 65kts of my chosen VDM seems to be an outlier, while the majority of the other observations around a similar time clump in the mid-80s. When plotted on the HRD wind map (below), the fix for the VDM shows as being well south of the area of maximum wind, thus leading to the lower wind speed estimate. This shows why it is important to use as much data as is available, including remote sources and in-situ ones; had we relied only on the one VDM, we would have gotten an erroneous estimate of intensity.
Annotation showing approximate point of fix for VDM. This is east of the eye but still well SW of the area of maximum surface wind shown on the HRD Wind Analysis. This likely led to the SFMR identifying the lower wind speed shown in the VDM.
Annotation showing approximate location of fix in VDM on multiplatform satellite surface wind analysis. The fix was likely taken on the NW to SE pass shown via yellow SFMR fixes.
The maximum surface wind is somewhere in the range of 88-93 kts at 1200Z on September 12. This compares favorably with the 90kts given in Table 1 of Ike’s Tropical Cyclone Report.
Excerpt from Table 1 shows maximum surface wind of 90 kts for 1200Z on September 12, 2008 for Ike. This is consistent with all our data except my chosen VDM, but an analysis of other contemporaneous VDMs lends support to this maximum surface wind speed. The HRD wind analysis is probably the best “match”, since it incorporates into its model a wide variety of remote and in situ data sources. It has the advantage over the VDM of being able to incorporate observations from these sources over a period of time, and it has an advantage over the multiplatform analysis in using in situ data sources as opposed to solely satellite sources. These in situ sources can help act as a reality check on remotely-sensed data. For full report, click link above.